
Create AI powered dashboards with Gemini 2.5 Pro and Onvo AI
Let's be honest, in today's whirlwind business world, being able to quickly understand your data isn't just a nice-to-have - it's how you stay ahead. But so many of us are still wrestling with clunky, old-school business intelligence tools. You know the ones: they demand a PhD in tech-speak, take ages to set up, and need constant babysitting.
But what if there was a better way? What if you could combine the brainpower of cutting-edge AI with dashboards so intuitive, they practically build themselves? Good news - that future is here.
This guide is all about a game-changing team-up: Google's super-smart Gemini 2.5 Pro model and Onvo AI's slick, embeddable dashboards. Whether you're coding behind the scenes, crunching numbers as an analyst, or leading the business charge, you're about to see how this duo can take you from a mountain of raw data to crystal-clear insights in minutes, not weeks.
Meet Gemini 2.5 Pro: Your AI Data Whiz
Think of Gemini 2.5 Pro as Google’s top-tier reasoning engine, and it's packed with some serious smarts:
- It tackles complex reasoning tasks (like those found on benchmarks GPQA and AIME 2025) without needing a ton of extra hand-holding.
- It’s a coding virtuoso, capable of everything from generating web apps to styling UIs right in your development environment.
- It’s a true multitasker, understanding text, code, audio, images, and video. Plus, it has a massive 1 million-token context window (soon to be 2 million!), meaning it can grasp incredibly complex requests.
- For the enterprise folks, it's ready to roll within Vertex AI, slotting neatly into your Google Cloud workflows.
All this means Gemini 2.5 Pro is tailor-made to power up your dashboards, from understanding your plain English questions to whipping up the code for your charts.
So, What's the Big Deal with Onvo AI?
Unlike those traditional BI tools that feel like a separate, cumbersome beast, Onvo AI was born to be different. It’s designed from the ground up for developers and for being easily embedded right where you need it.
Here’s why Onvo AI is turning heads:
- Connect to (almost) anything: With 500+ data integrations (think Airbyte, REST APIs, CSVs, and more), getting your data in is a breeze. It even uses AI to auto-document your fields - how cool is that?
- AI chart builder: Just tell it what you want to see, in plain English. "Show me sales by region as a bar chart." Done.
- A developer's best friend: SDKs and APIs for Node.js, React, Python, Ruby, and Web Components. They speak your language.
- Shareable & embeddable: Export to PDF/PPT or, even better, embed beautiful, interactive dashboards directly into your customer-facing products.
- AI at its core: This isn't some AI feature bolted on as an afterthought. AI is woven into every interaction you have with your data.
Let's Get Practical: Hooking Up Gemini 2.5 Pro with Onvo AI
Alright, theory's great, but let's see how easy it is to get these two powerhouses talking.
- Get Your Onvo AI Account Rolling: Pop over to
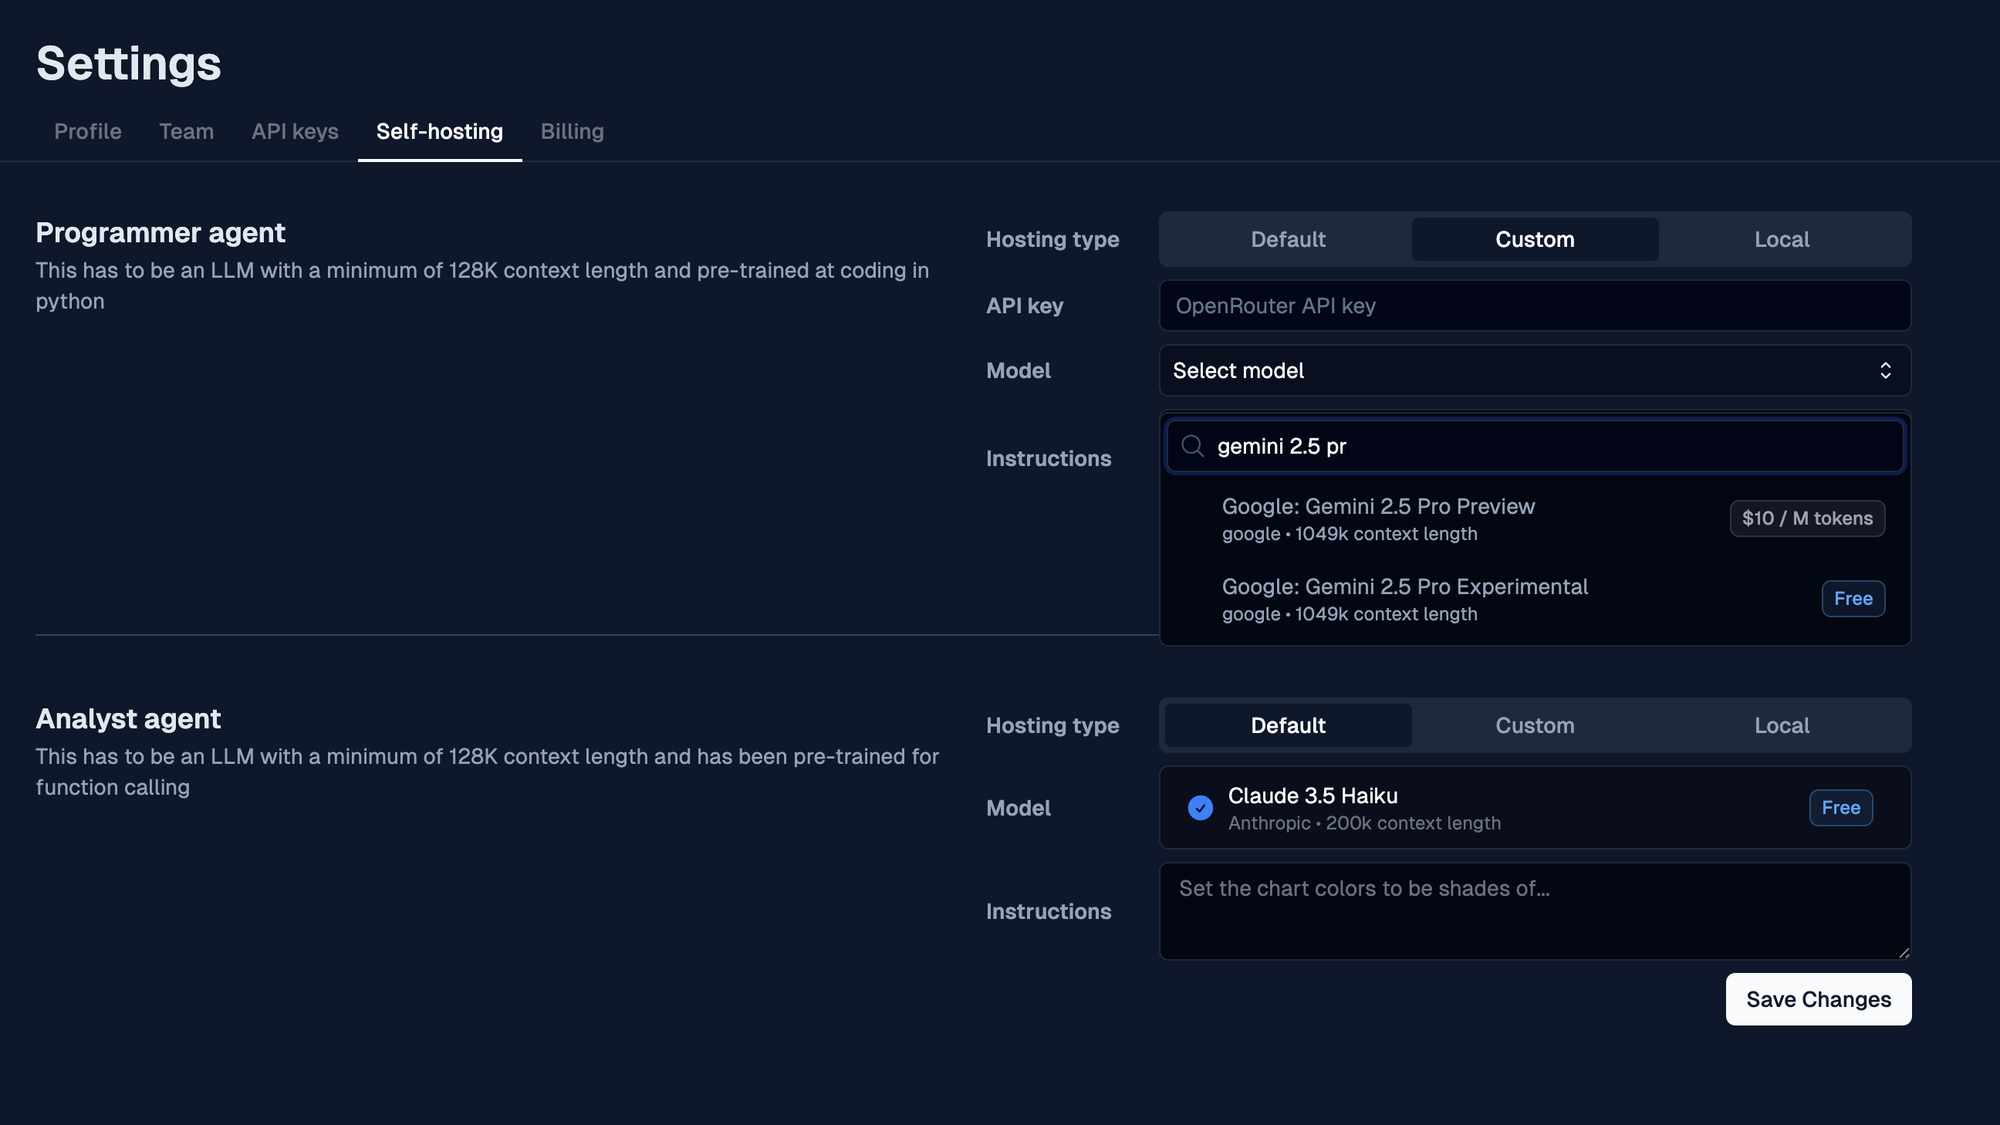
dashboard.onvo.aiand sign up. Once you've clicked that confirmation email, you’ll land in the main dashboard area, ready to go. - Link Up with Gemini 2.5 Pro: This is where the magic starts to happen. You're basically giving Onvo AI a direct line to Gemini 2.5 Pro's brain.
- In the Onvo AI dashboard, find Settings → Self Hosting in the left sidebar.
- Look for the "AI Agents" section. You'll see "Programmer" and "Analyst" agent settings.
- From the dropdown, choose "Gemini 2.5 Pro via OpenRouter".
- Got your own Gemini 2.5 Pro instance running through Vertex AI? No problem - just plug in your custom endpoint URL.
- Hit save! Now, all your natural language queries and chart creation will be supercharged by Gemini 2.5 Pro.
- Bring Your Data to the Party: With the AI engine warmed up, it's time to feed it some data. Onvo AI creates a smart data catalog, which helps Gemini 2.5 Pro understand what's what. To make your natural language queries really sing, give your data good descriptions.
- Head to the Integrations page in Onvo AI.
- You'll see a ton of connectors. Find yours (Google Sheets, Airtable, PostgreSQL, you name it).
- Follow the simple steps to get connected. Onvo AI will then scan your data structure.
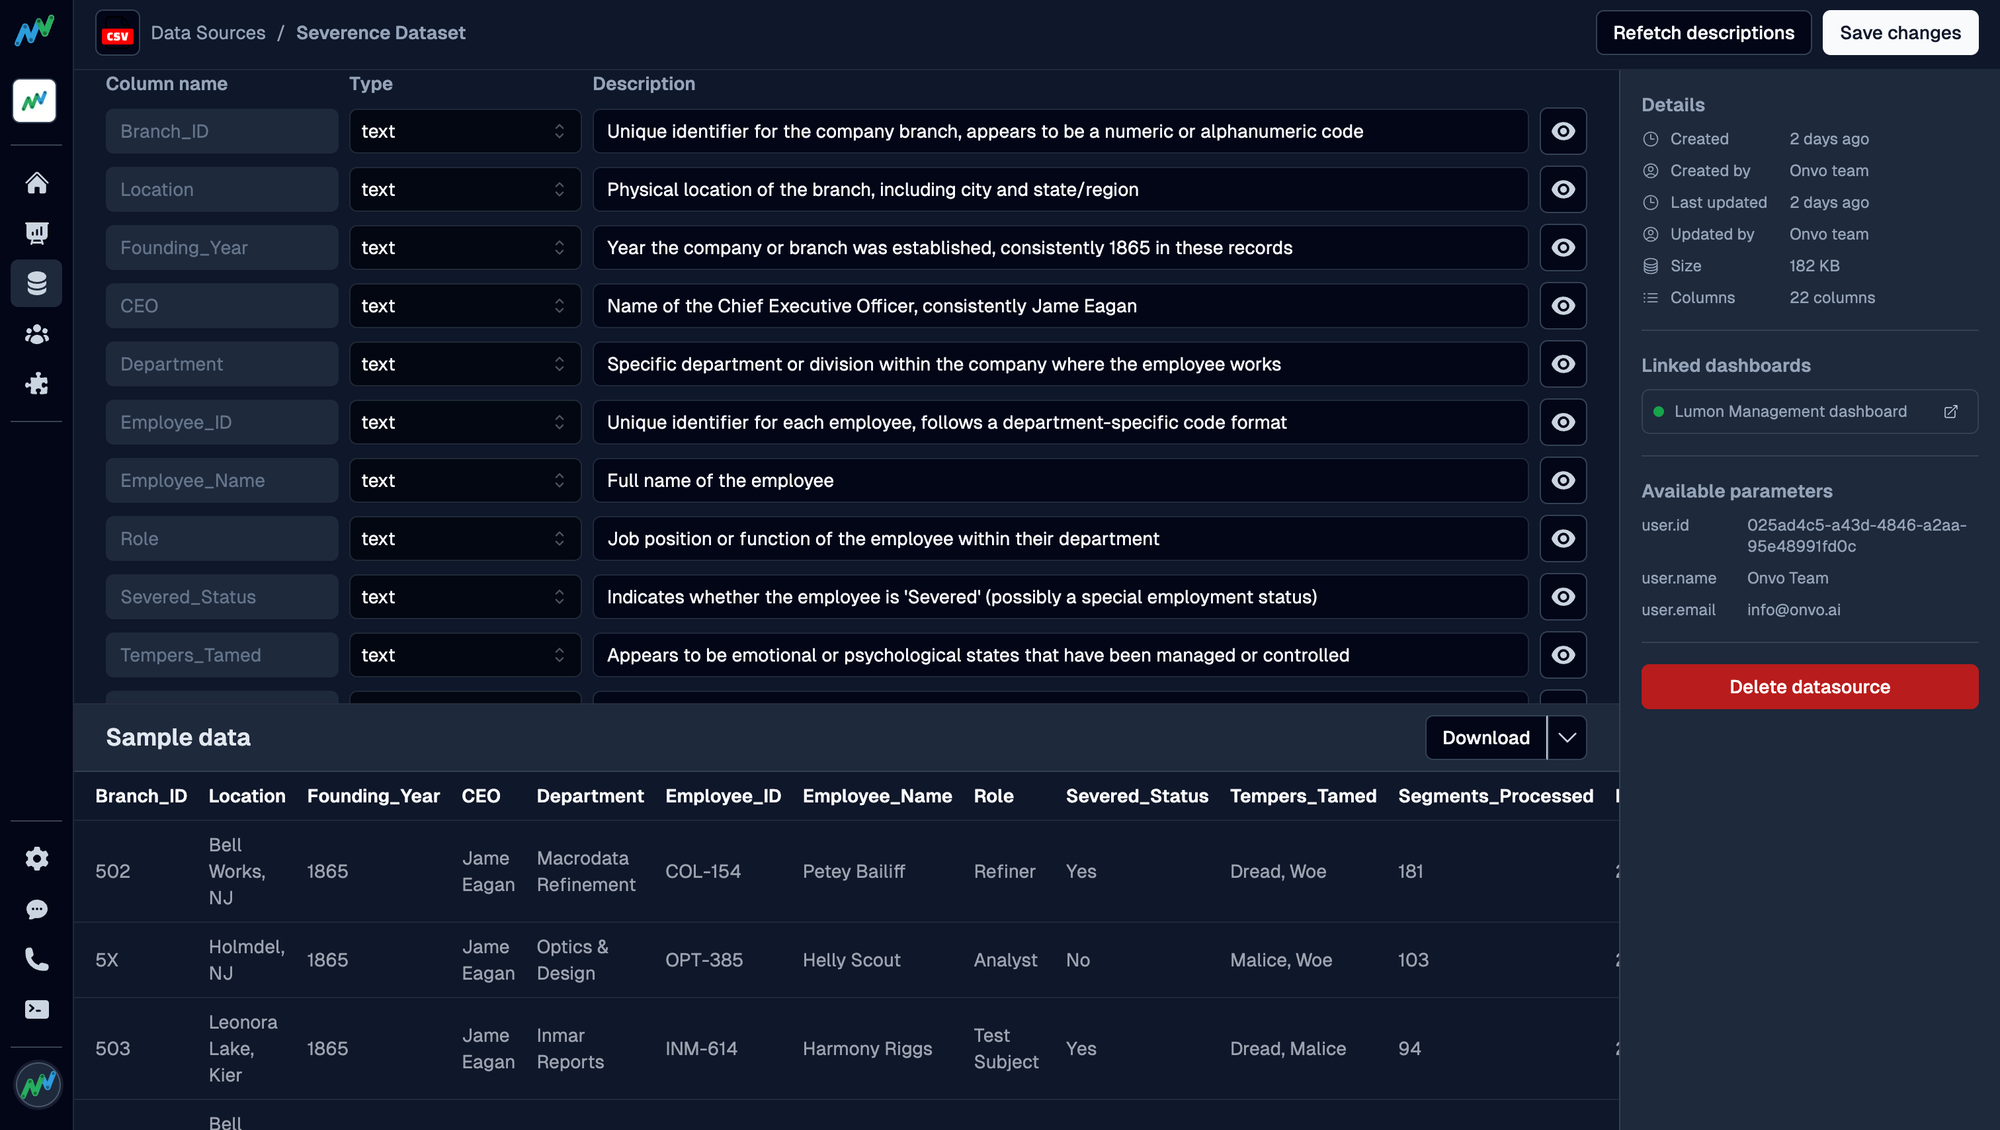
- Go to Data Sources in the sidebar.
- Check out the tables and fields Onvo AI imported.
- You'll see AI-generated descriptions. Tweak these if needed! For example, instead of a generic "date_created," clarify it like: "The date a customer first signed up, tracked in UTC." The more context, the smarter Gemini 2.5 Pro gets with your requests.
- Build That Dashboard (the Fun Part!): Now, prepare to be amazed. This is where it gets really cool. Instead of fiddling with code or SQL, just keep talking to it: Keep adding visuals to your dashboard:
- Navigate to Dashboards → New Dashboard.
- Give it a name that makes sense, maybe a quick description.
- Pick the data sources you want to use.
- Click "Create Dashboard," and you're in the editor.
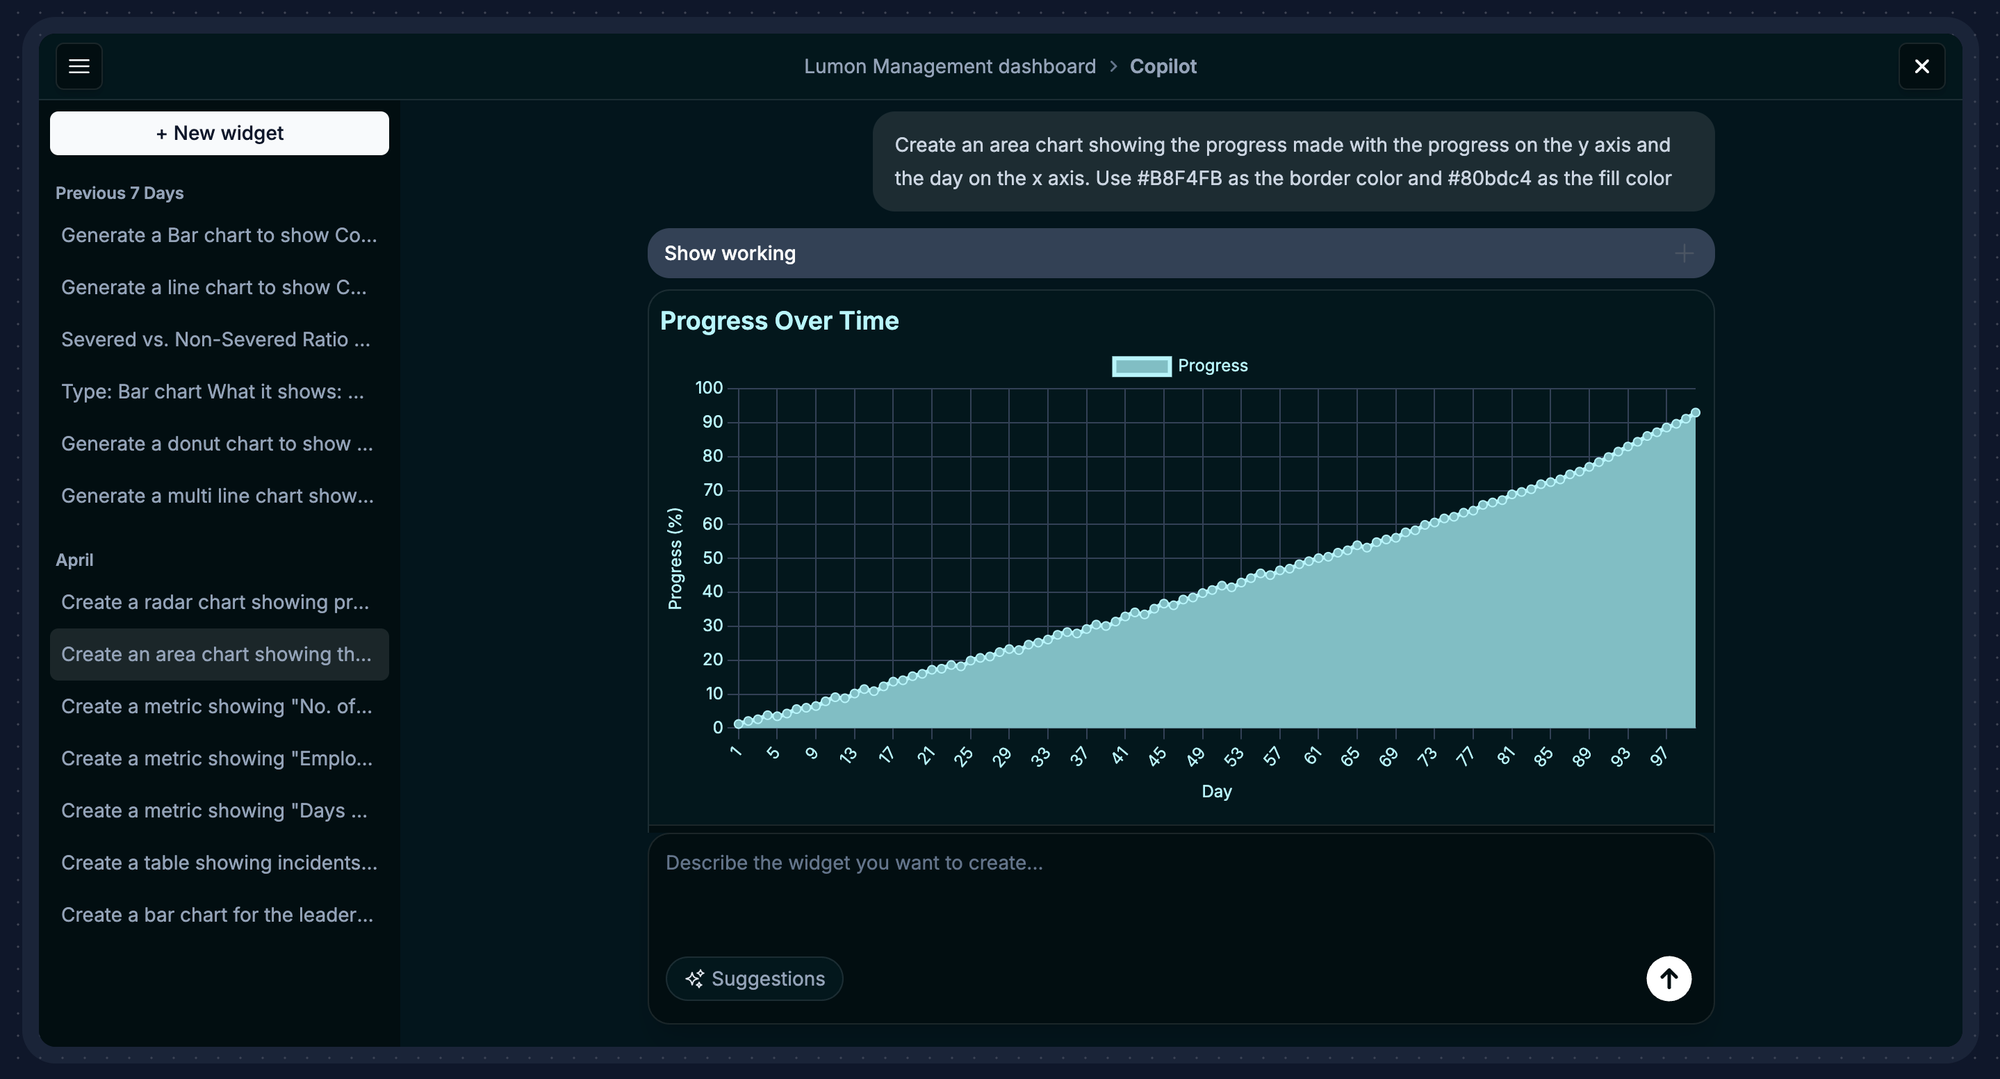
- Find the "Ask AI" button (usually at the bottom).
- Type in what you want to see. Don't be shy with details!
- "Create a red bar chart showing our monthly sales totals for the last year, and add a trend line showing the overall growth."
- "Show me a map of customer acquisition costs by state. Make the states with higher costs darker."
- "Generate a scatter plot comparing customer lifetime value against acquisition cost. Size the dots by how long they've been a customer and color them by how we got them."
Watch Gemini 2.5 Pro work its magic, generating the query and the chart code.
- Review the preview. Need a tweak? Just ask!
- "Change the colors to our brand's blue (#1a75ff) and green (#00cc88)."
- "Add labels showing the percentage change from last month."
- "Can you split this into separate charts for each product category?"
- Happy with an AI-generated chart? Click "Add to Dashboard."
- Drag and drop your charts to arrange them just how you like. Resize them by pulling the corners.
- Add text cards with notes or explanations (markdown friendly!). Set up filters that let users explore the data across multiple charts.
- Share Your Masterpiece: Embedding Your Dashboard: Once it's looking sharp, getting it into your app is a piece of cake. Just like that, you've gone from raw data to an interactive, AI-powered dashboard embedded right where you need it - all without wrestling with SQL or complex charting libraries.
- Click the "Share" button (top right).
- Select "Embed."
- Choose your weapon: React component, JavaScript snippet, iFrame, or server-side rendering.
- Copy the code, paste it into your application, and boom!
The Bottom Line: Analytics Just Got a Whole Lot More Human
When you bring together Google's Gemini 2.5 Pro and Onvo AI's embedded dashboard platform, you're not just getting another analytics tool. You're fundamentally changing how your entire organization talks to data. The old walls between people and insights? They're crumbling. Now, anyone can ask questions and get immediate, visual answers.
Think about what this unlocks:
- Data for Everyone: Your non-technical teammates can dive deep into analysis without waiting for the data science crew.
- Looks Good, Every Time: AI-generated charts naturally follow best practices, keeping your visuals consistent and clear.
- Insights Where You Work: Embedding analytics directly into your apps means data informs decisions right in the moment.
- Happier Developers: Less time spent on dashboard upkeep means more time for your tech team to build amazing core features.
We're just scratching the surface of what's possible as AI models like Gemini 2.5 Pro get even smarter and platforms like Onvo AI keep innovating. The future of analytics is less about technical wrestling and more about asking the right questions and taking smart actions.
Ready to see this in action and change your relationship with data? Head over to www.onvo.ai and discover how Gemini 2.5 Pro and Onvo AI can start delivering insights in seconds, not weeks.