Understanding Visual Analytics: Empowering Informed Decision-Making

Imagine you're at the helm of a company and two teams approach you with sales strategies. One team presents an Excel sheet detailing last quarter's sales figures, while the other offers a dynamic dashboard allowing deep analysis of individual products and date ranges. Which team would you trust?
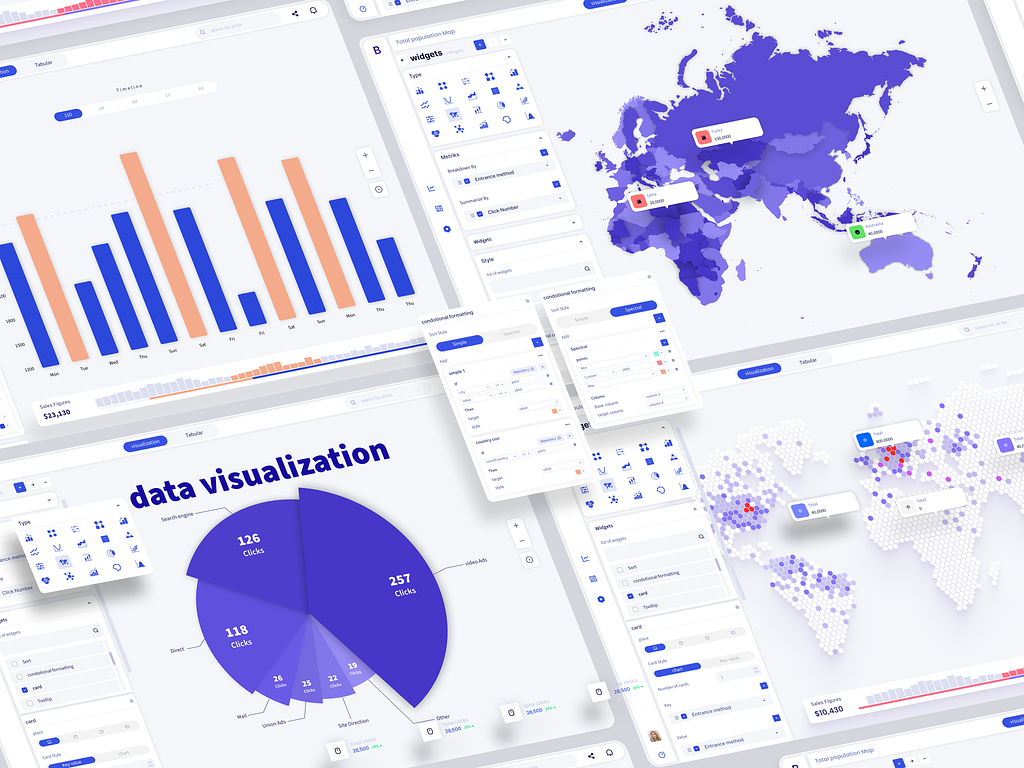
The latter exemplifies visual analytics—a process of analyzing visual representations of data, enabling decision-makers to leverage understandable data insights. Let's delve into visual analytics and its significance in today's business landscape.
What is Visual Analytics?
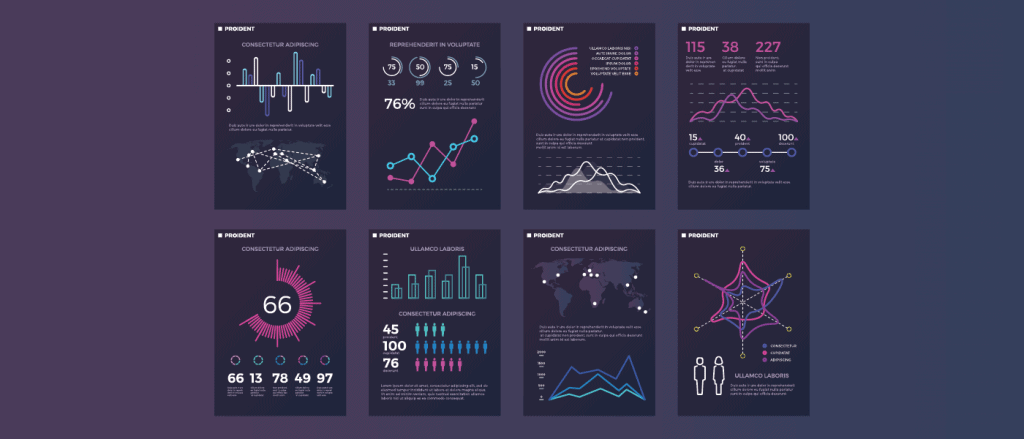
Visual analytics entails using tools and techniques to analyze visualized data representations. Instead of grappling with raw data, visual analytics leverages graphs, charts, and other visualizations, empowering business users to make data-informed decisions.

Differentiating Data Visualization and Visual Analytics
Although often grouped together, there are distinct disparities between data visualization and visual analytics:
- Data visualization: The presentation of data visually, simplifying complex datasets for easier interpretation.
- Visual analytics: Merging data visualization with analysis, facilitating user interaction for data exploration, pattern recognition, and insights extraction.
Understanding the Benefits of Visual Analytics
Visual analytics offers numerous advantages, including:
- Data Exploration: Intuitive interfaces enable deep dives into complex datasets, uncovering actionable insights.
- Enhanced Decision-Making: Interactive interfaces bridge the gap between data management and decision-making, empowering users at all levels.
- Trend Identification: Utilizing advanced algorithms and machine learning, users can discern trends, patterns, and even forecast future outcomes.
- Real-Time Insights: Integration with diverse data sources enables access to real-time data, facilitating rapid decision-making.
- Improved Communication: Visual analytics fosters understanding and collaboration across diverse teams, irrespective of data literacy levels.
- Interactive Dashboards: Platforms like Luzmo offer customizable dashboards, enabling users to tailor views and extract pertinent information.
- Collaborative Insights: Teams gain access to valuable customer, product, and metric insights, fostering collaboration and knowledge sharing.
- Seamless Data Integration: API-first visual analytics software allows seamless integration with various data sources, eliminating integration limitations.
Examples of Visual Analytics in Action
Inspiring examples of visual analytics implementation include:
- Kenjo's HR dashboards offer over 30 interactive dashboards, empowering users to explore employee data effortlessly.

- Riskonnect's self-service analytics dashboard eliminated the need for custom reports, enhancing customer experience and reducing workload.

- Spaceflow reduced custom report requests by 80% through self-service embedded analytics dashboards.

Embark on Your Visual Analytics Journey Today
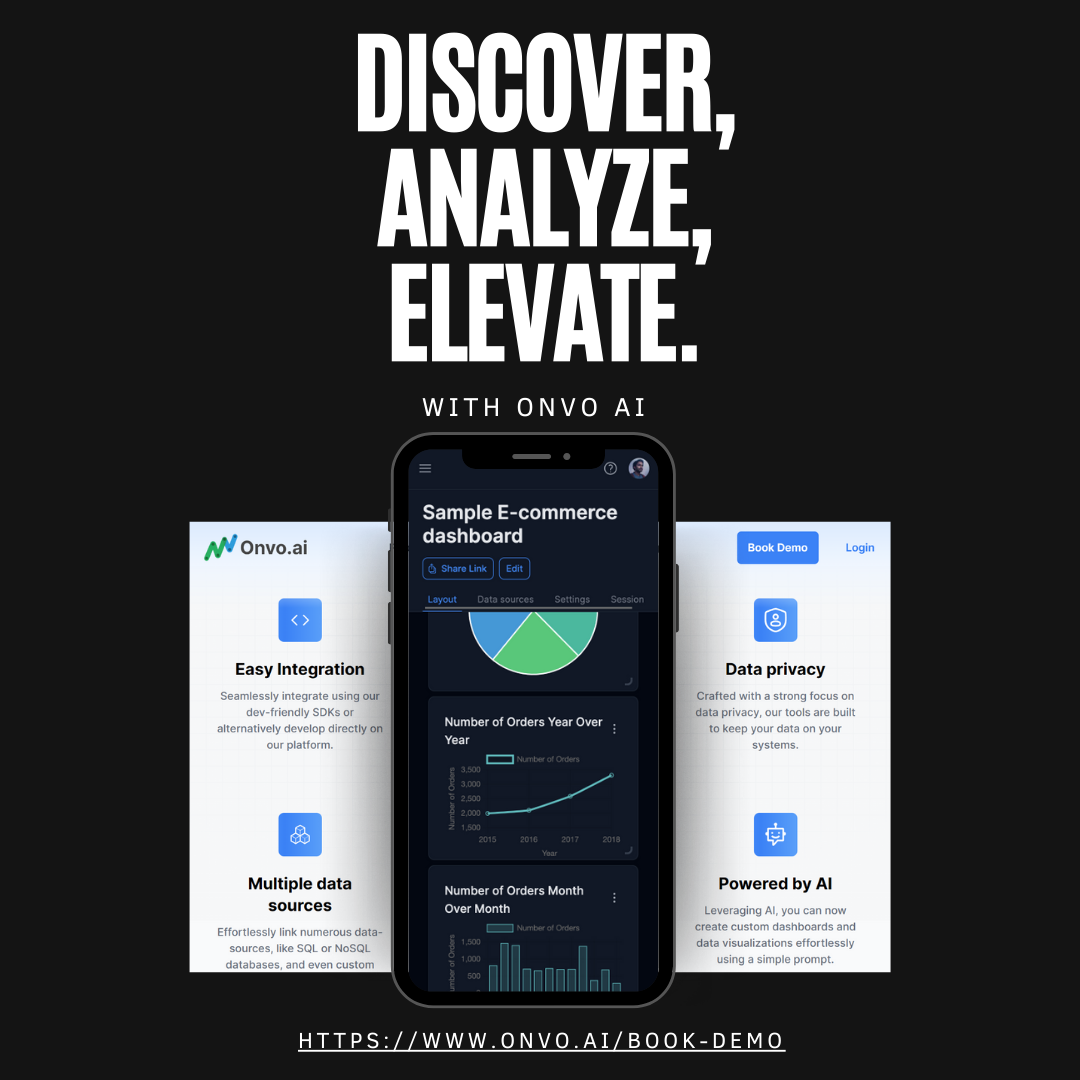
For SaaS businesses, integrating visual analytics not only enhances customer experiences but also boosts revenue opportunities. With Onvo's embedded analytics, you can empower your customers to explore data independently and drive product engagement.

Experience the transformative power of visual analytics with a free trial of Onvo. Book a demo today to unlock the full potential of embedded analytics in your product!

